Interacting
with the 2-D Color Map/Contour Map
|
To do
the following...
|
You
should...
|
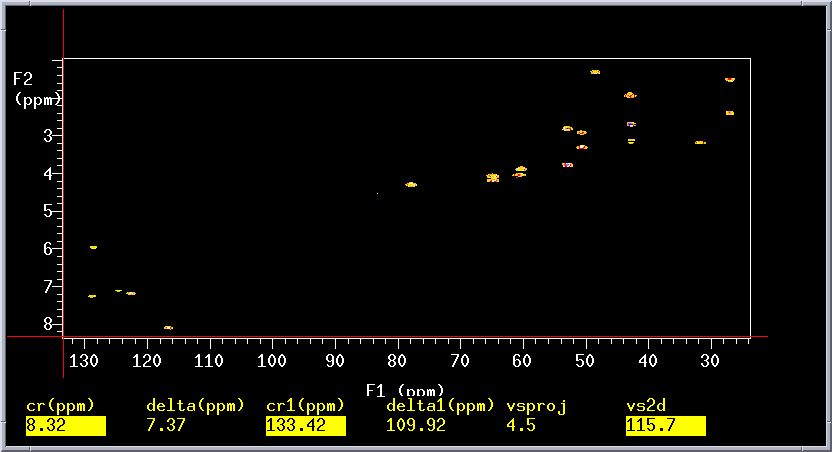
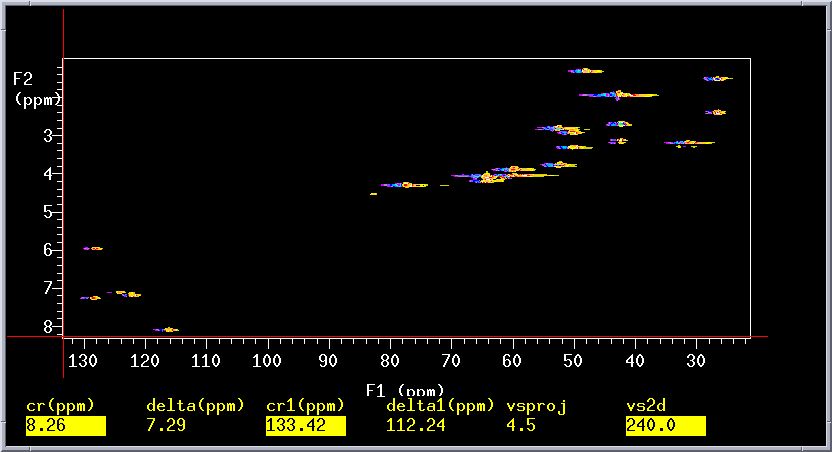
Increase/Decrease the scale
|
Click on either vs+20% or vs-20% or
type vs2d=vs2d*1.5 and click Redraw.
The typed command increases the display by a factor of 1.5.
You can use a larger number if you like (e.g. vs2d=vs2d*2,
increases by a factor of 2.
|
Change the number of color levels
|
Use the middle mouse button to click on the
color scale to the right of the color plot. Click on the smaller
number to increase the number of colors displayed.
|
To expand on a region
|
Ensure that you are in the interactive mode;
if not, click Main Menu=>Display=>Color
Map. Click with the left mouse button on the left-most
point of your desired region. Click with the right mouse button
on the right-most point. Click on Expand.
|
To expand an exact region
|
Type sp=#p wp=#p (for the F2 dimension,
usually vertical) and sp1=#p wp1=#p (for the F1 dimension,
usually horizontal), where # are the numbers in ppm for the
region of interest. sp designates the start of plot and wp
is the width of the plot. You will need to click on Redraw to
update the screen. For example, I want to expand the region
between 1 and 4 ppm in F1 and between 2 and 4 ppm in F2, I
would type sp=2p wp=2p sp1=1p wp1=3p, then I click Redraw to
see the result.
|
To reference the 2-D spectrum
|
Expand the region of interest. Click Hproj(max) for
the horizontal projection and Vproj(max) for
the vertical projection. Place the cross-hair cursor on the diagonal
position you wish to reference (the projections will help you
to orient the cross-hair). Type rl(#p) rl1(#p*dfrq/sfrq),
where # is the value in ppm you want to be the reference. rl
sets the
F2 dimension reference and rl1 sets the F1 dimension reference. |
Redisplay the spectrum
|
Click on Redraw.
|
Display a projection of the 1D spectrum
on the side of the 2-D plot
|
Click Proj, then click Hproj(max) for
the horizontal projection or Vproj(max) for
the vertical projection. Use the middle mouse to adjust the
scale.
|
Display a trace of the 2-D plot
|
Click Trace and use the left mouse button
to drag the cursor. |
View the contour plot
|
Click Main Menu=>Display=>Contour
|
Increase number of levels on contour plot:
Interactive plot
|
Type, for example, dconi('dpcon',15,1.2).
The dpcon flag is for displaying the contours. The first number
(15, in this case) is the number of contour lines (default
is 4). The second number (1.2, in this case) is the relative
spacing intensity (default is 2). You can input different numbers
if you wish, but the second number must be greater than 1.
|
Increase number of levels on contour plot:
Non-interactive plot
|
Type, for example, dpcon(15,1.2).
The dpcon flag is for displaying the contours. The first number
(15, in this case) is the number of contour lines (default
is 4). The second number (1.2, in this case) is the relative
spacing intensity (default is 2). You can input different numbers
if you wish, but the second number must be greater than 1.
|
The gHMBC is used to help establish the
carbon skeleton through the multiple bond carbon to hydrogen connectivity.
This experiment is relatively insensitive as compared to gHMQC because
multiple bond correlations are less efficient than one bond correlations.
Typical one-bond coupling constants are around 150 Hz whereas multiple-bond
coupling constants fall in the range of 5-15 Hz, which is similar to
the range for H,H-homocoupling.
*Some sections of this page were adapted from procedures by Long Lee and
Kermit Johnson.


